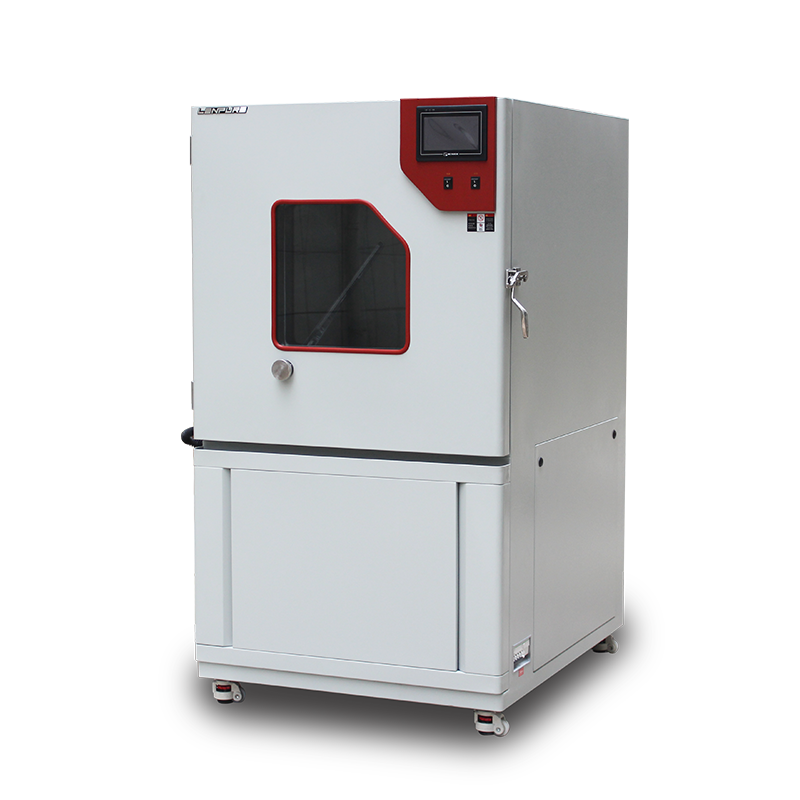

I. The Phenomenon: Why Has the Bottleneck Appeared All at Once?
During the past twelve months, several third-party testing bodies and OEM laboratories reported the same problem: when running dust tests in accordance with GB/T 4208, IEC 60529 or MIL-STD-810, the batch cycle has stretched from 48 h to 72 h, even 96 h, while energy consumption has risen by more than 30 %. The chambers still “look” busy, yet dust settlement fluctuates widely and the surface coverage of specimens is inconsistent—so much so that final reports are being rejected in follow-up customer audits. The bottleneck is no longer a single failure; it is the simultaneous stall of time, energy and quality.

II. Root-Cause Translation: From “Experience” to “Quantifiable Indicators”
1. Technology Layer: Old Architecture Meets New Standards
1.1 Air-loop design still follows the 15-year-old “one-side supply + top return” scheme. Under IP6X high-dust conditions (≥ 2 kg/m³) the air velocity decays 38 % after only 3 h, and settlement uniformity deviates by 25 %.
1.2 The servo vibrator is locked at 50 Hz and cannot adjust impact energy in real time as dust agglomerates; filter blockage time shortens to 4 h, doubling manual cleaning shutdowns.
1.3 Heating element is still Ni-Cr wire with large thermal inertia; ramp-up and cool-down occupy 28 % of the total cycle, becoming the pacing bottleneck.
2. Asset Layer: Hidden Depreciation Hidden from the Books
2.1 Second-hand compliance trap: some chambers built before 2012 have door seals permanently compressed by 1.2 mm; measured leakage reaches 5.6×10⁻³ m³/min, far above the ASTM D4169 limit of ≤1×10⁻³ m³/min for dust tests.
2.2 Non-linear degradation curve: after 8 000 h the centrifugal fan efficiency drops 15 %, yet current rises only 4 %—easily overlooked in daily rounds.
2.3 Dust-recovery system is off the depreciation list; once the screw-conveyor blade is worn, recovery falls from 95 % to 78 %. After 16 h of continuous testing the internal concentration can no longer return to nominal.
3. Management Layer: PM/CM Out of Balance
3.1 SOP triggers maintenance by calendar time, not by condition; the differential-pressure sensor is blinded by dust, underestimating real clogging by 40 %.
3.2 Test schedules collide with maintenance windows; to save two hours of planned filter cleaning, the next batch needs an extra 3.5 h to regain velocity.
3.3 No energy baseline exists, so “efficiency loss” cannot be assigned to process or equipment; improvement stops at the empirical level of “blow a little longer”.
III. Diagnostic Toolbox: Make the Bottleneck Visible
Air-velocity & Energy Coupling Test: record airflow (hot-wire anemometer), current clamp and power analyser at no-load, 50 % load and 100 % load; build a 3-D “velocity–current–power” surface—deviation >10 % flags fan-motor mismatch.
Dust-Concentration Closed-Loop Audit: use a laser particle sizer (0.3 µm–10 µm) at nine sampling points; relative standard deviation >5 % marks uniformity failure.
Thermal Imaging Quick Scan: inspect heater zone, door seal and electrical bay; ΔT >3 °C indicates heat leak or local short.
OEE Digitalisation: feed availability, performance and quality into the MES; set “dust-test OEE ≥75 %” as green line to trigger automatic work orders.
IV. Systemic Improvement: From “Single-Part Replacement” to “Life-Cycle Optimisation”
A. Technology Upgrade: Rejuvenate the Old Box
CFD-optimised loop: dual-side bottom supply + slanted bottom return with guide vanes keeps velocity decay within 8 %.
Variable-frequency vibrator + fuzzy control: real-time differential-pressure feedback, frequency 0–100 Hz, extends filter clog cycle to 12 h.
Silicon-nitride ceramic heaters replace Ni-Cr wire, raising heating rate by 40 %; cooling uses compressor “reverse unloading”, shortening one cycle by 1.8 h.
On-line weighing module for dust recovery: alarm when recovery <90 % to prevent “concentration drift” invalidation. B. Asset Strategy: Turn “Depreciation” into “Predictable Cost” Build a two-dimension database of “component efficiency vs. life”; fans, heaters, filters and seals get an efficiency threshold—replacement triggered once it is crossed. Introduce a “shared refurbishment” model: for 5- to 8-year-old chambers, the OEM recycles reusable parts (impeller, sheet metal); the user pays only 40 % of new-chamber price to obtain the latest air-loop and control system. 32-item admission evaluation for any second-hand unit: if leakage, velocity or energy fails, the whole chamber is rejected—no “sick service” allowed. C. Management Mechanism: Let Data, Not Experience, Decide Shift PM trigger from fixed 500 h to dual thresholds “ΔP >1 200 Pa or OEE <75 %”, cutting 30 % unnecessary downtime.
Create a “test & maintenance” dual calendar; APS algorithm automatically staggers high-priority projects and maintenance windows.
Include energy baseline in KPI: if single-batch power consumption exceeds baseline by 10 %, root-cause analysis is launched; three consecutive excesses freeze chamber usage rights.
V. New-Chamber Selection: A “Genetic Engineering” Approach to Avoid Bottlenecks
When diagnosis shows the old platform cannot meet the new dynamic dust requirement in GB/T 4208-2022 even after partial upgrades, select a new generation chamber. Evaluation should cover at least:
Energy index: ≥25 % more efficient than legacy models (field verified).
Intelligence: built-in Ethernet, OPC-UA, four-in-one visualisation of OEE, velocity, concentration and energy.
Maintainability: filter, vibrator and heater modules front-accessible for 5-minute swap-out.
Expandability: reserved humidity and salt-spray ports for future three-in-one tests, avoiding reinvestment.
Warranty: five years or 10 000 h on core parts; leakage, velocity and uniformity written into contract—free replacement if not met.
Conclusion
The surface story of a dust-test chamber bottleneck is “less air, more clog, higher power”; the deeper narrative is the simultaneous failure of technology architecture, asset strategy and management mechanism. Only by translating “experience language” into “data language”, moving “post-failure repair” forward to “predictive maintenance”, and upgrading “single-part replacement” to “systemic reconstruction” can the bottleneck be truly broken and the optimum of time, energy and quality achieved. For laboratory managers still at the decision crossroads, the present moment is the best window to bring equipment efficiency into the enterprise digital-transformation roadmap—so that every whiff of raised dust becomes a measurable, predictable and optimisable particle of value.